TRACKERS UX
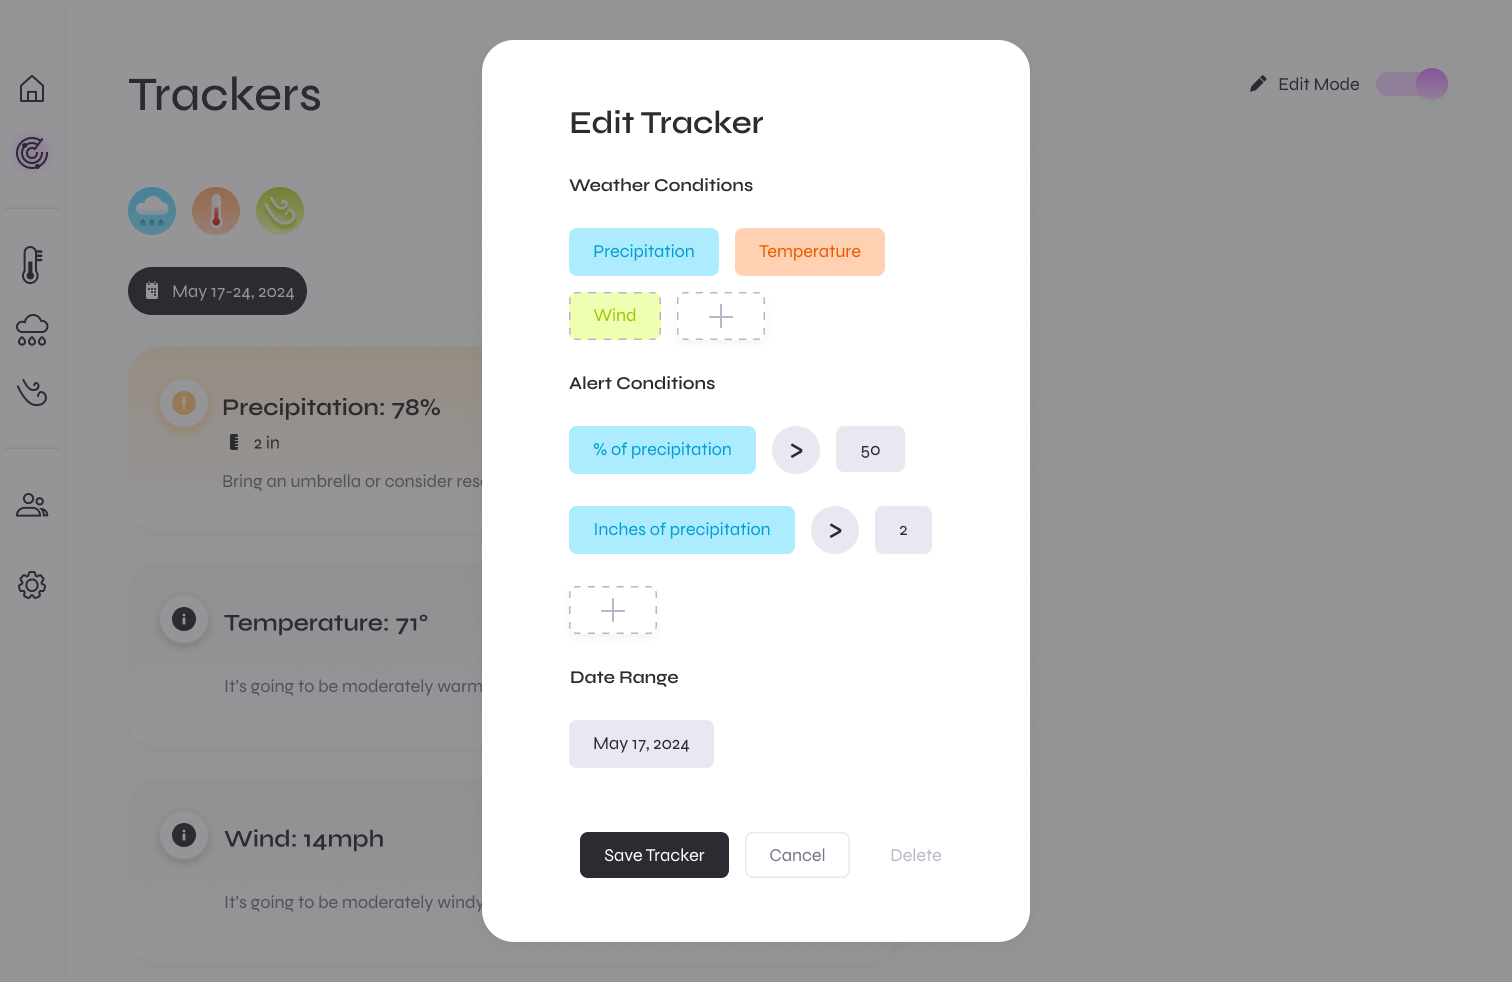
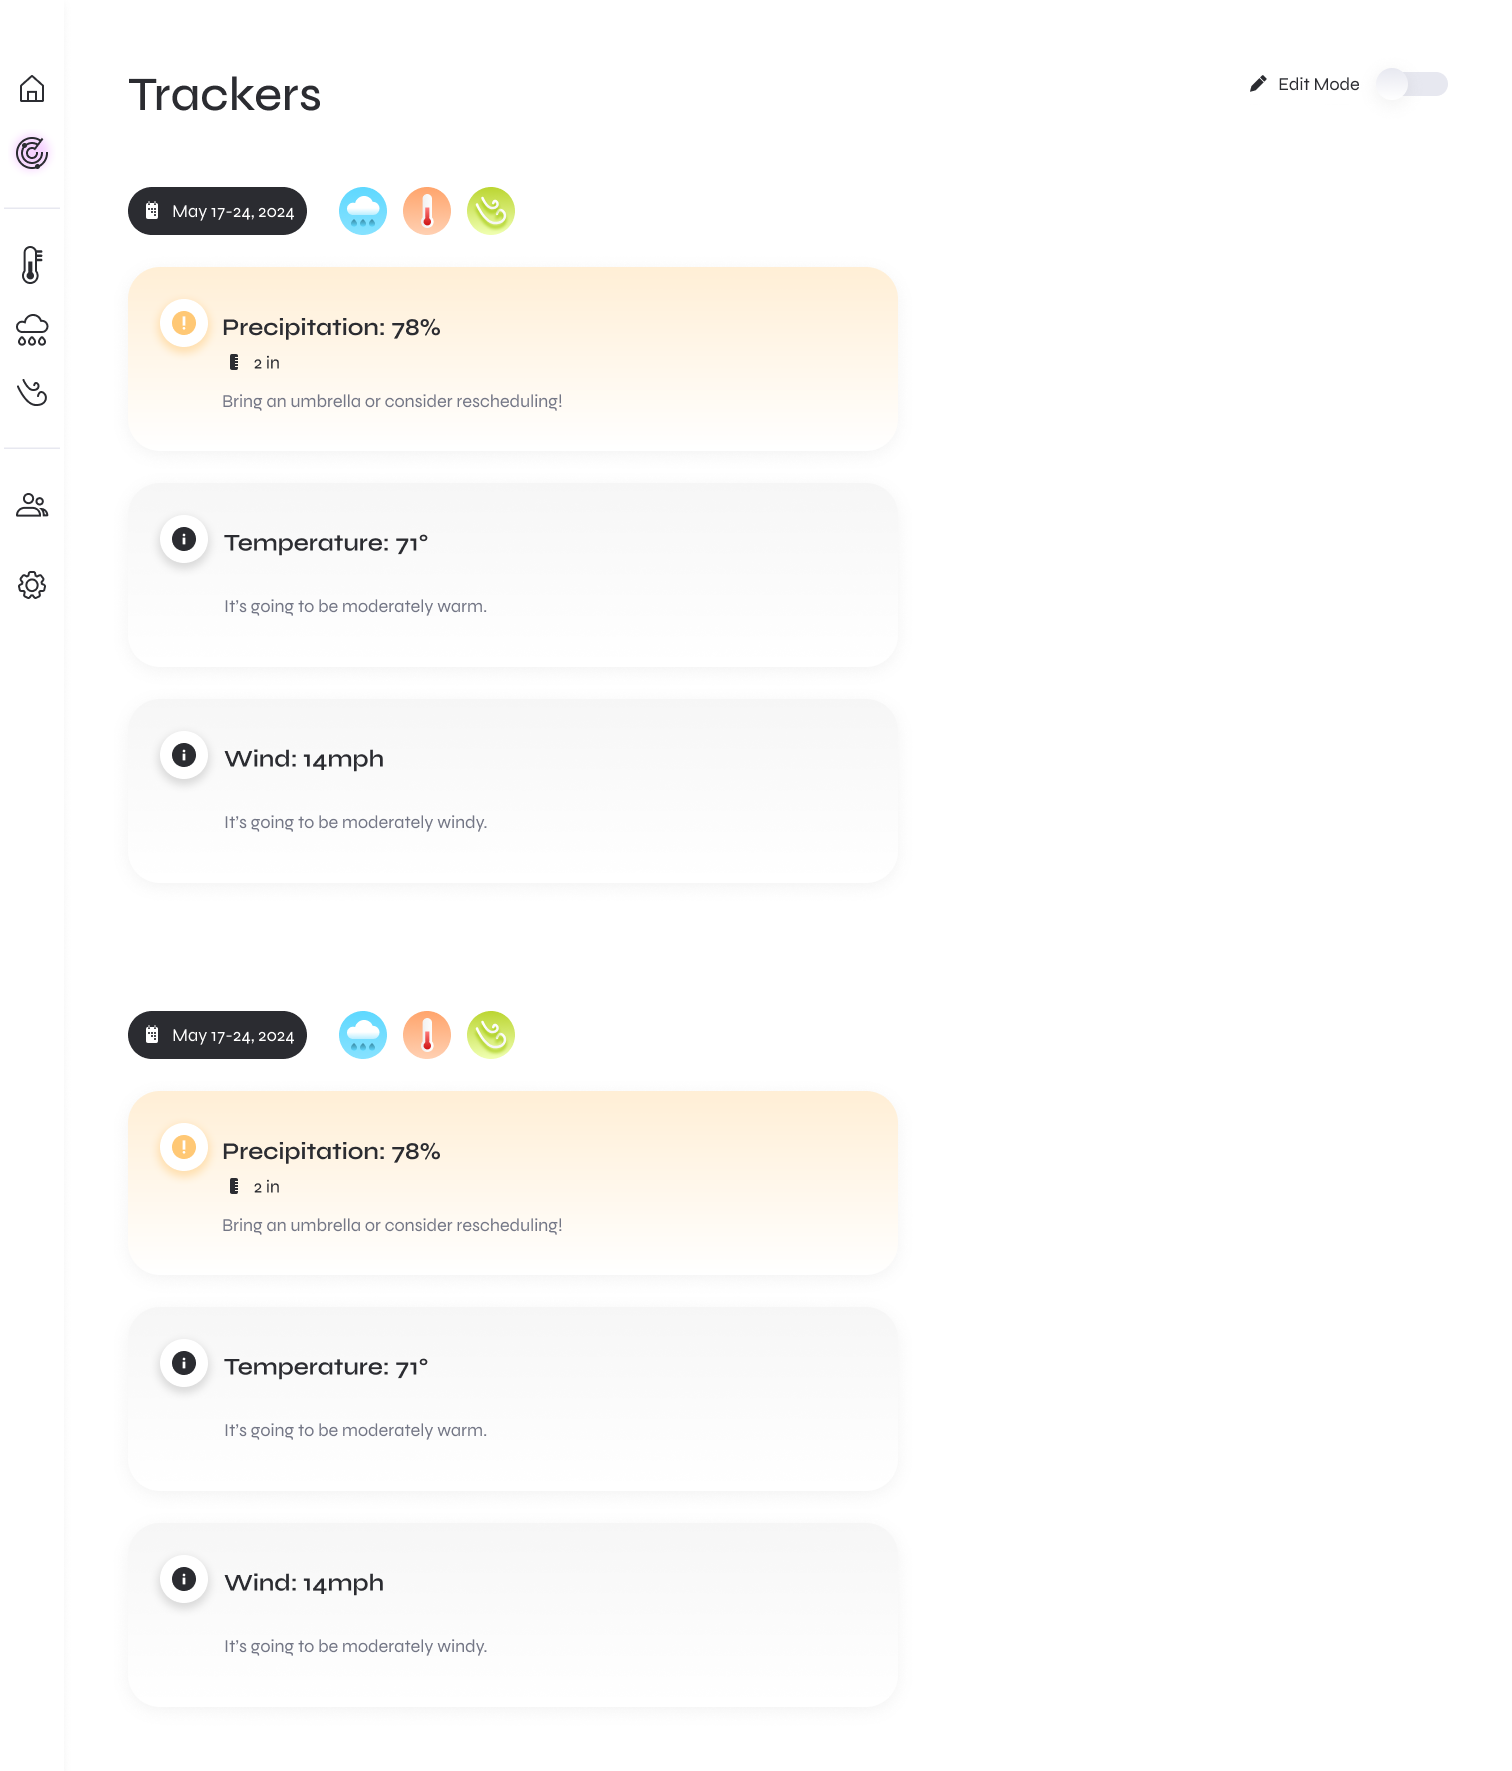
Threshold-aware cards: When a user’s metric (e.g., precip > 50%) threshold limit is exceeded, the card turns yellow/orange and elevates the headline stat; a short action line translates it into a decision.
.png)
User control: Thresholds are editable per Tracker.
Progressive disclosure: “+” chips reveal optional conditions so users only see what they need, allowing for fast first-time setup.
Color language: Metric chip colors are stable (precip=blue, temp=orange, wind=green). Alerts use a dedicated warning icon/tint, so metric colors never imply severity.
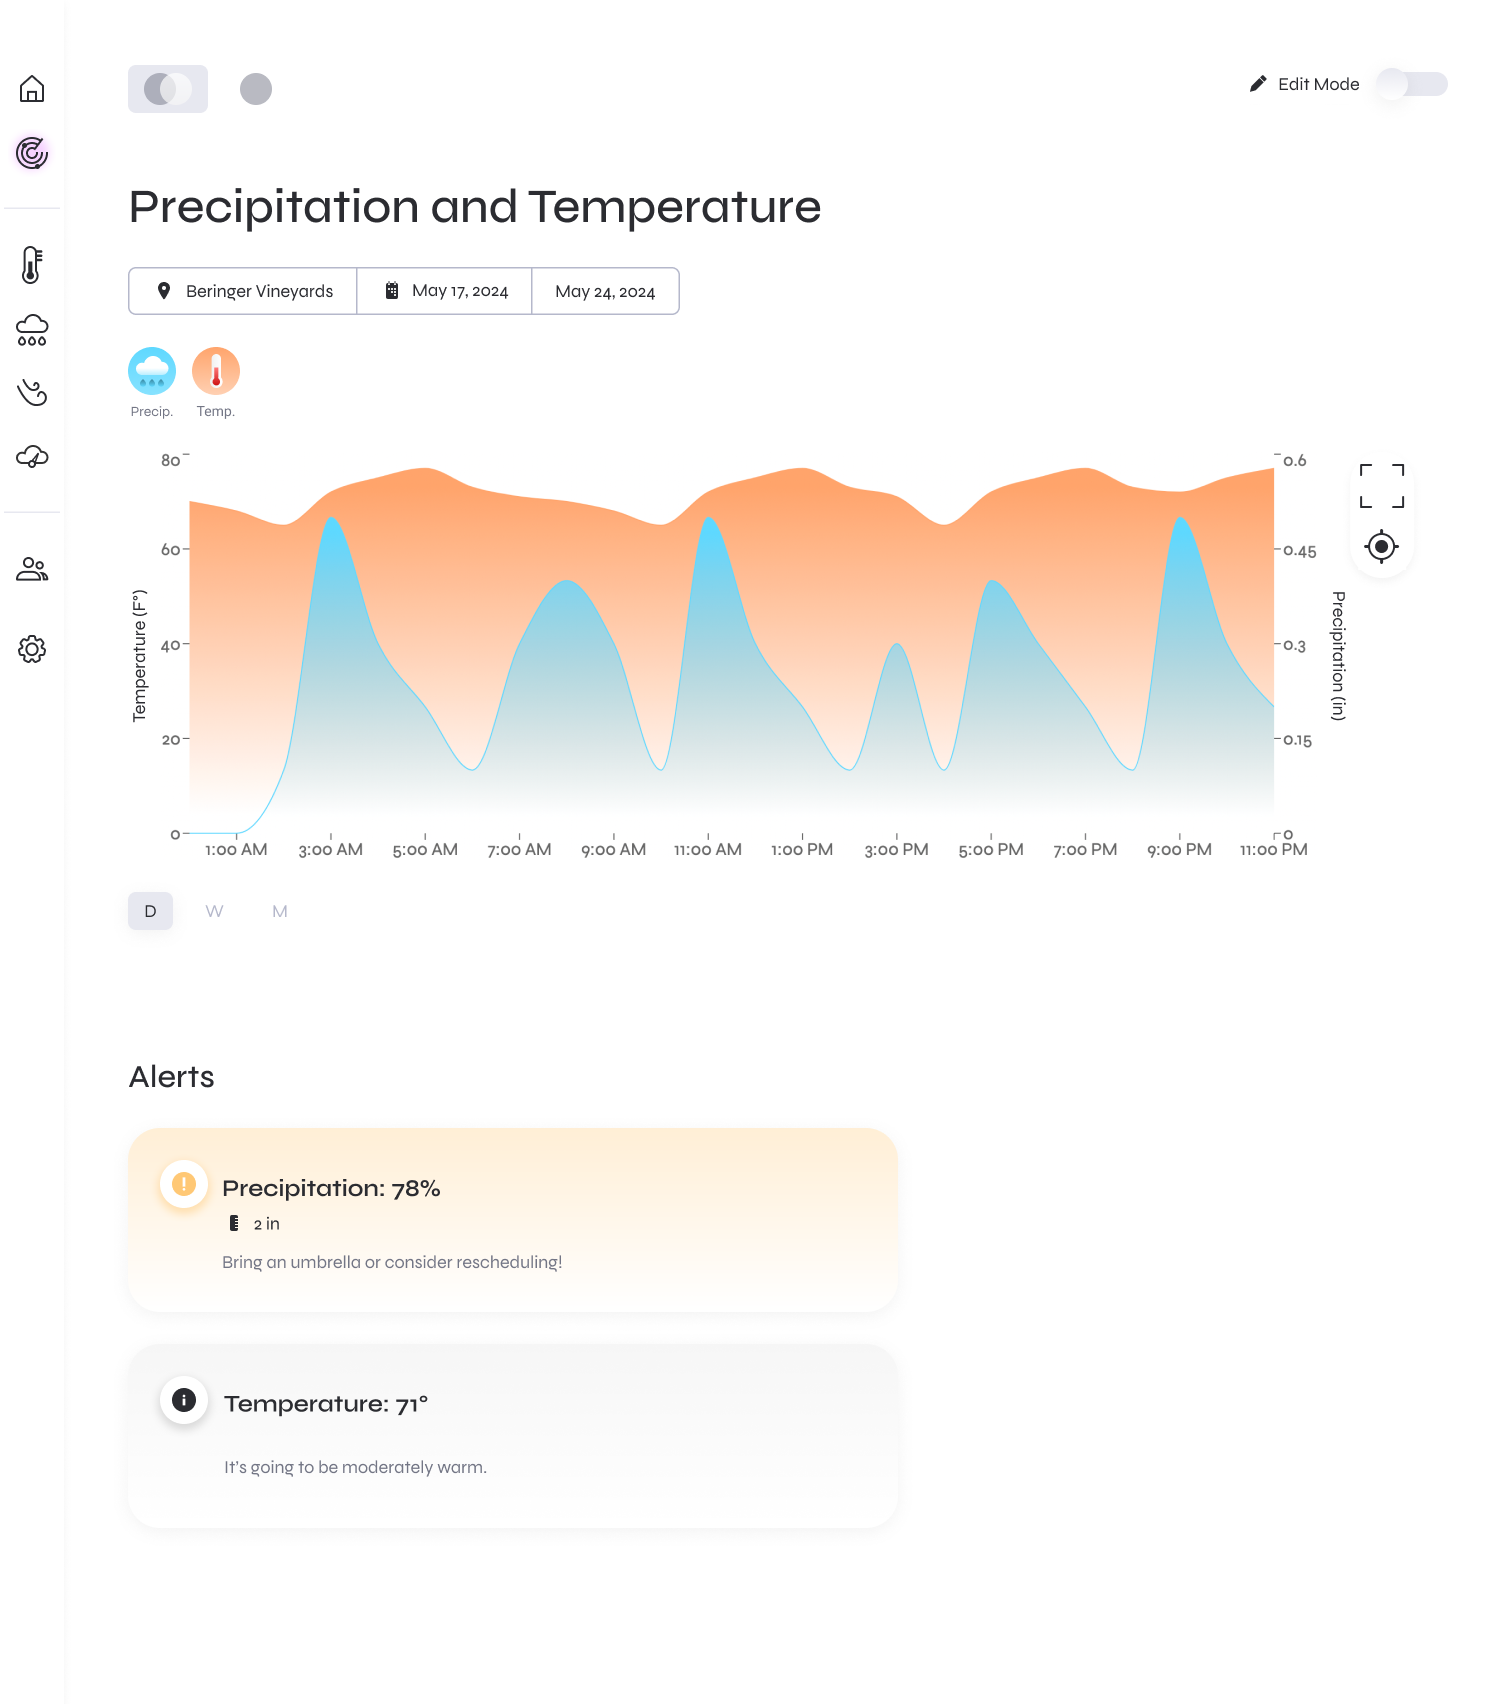
This page shows one tracker’s window (venue + dates) with only the metrics selected for that tracker.
Alerts panel: Threshold crossings roll up as plain-language alerts under the chart (e.g., “Bring umbrellas…”). Guidance lives with the tracker, not in the global weather tab.
Familiar chart, focused context: The area chart uses the same palette as Home, but is scoped to the tracker so trends map directly to decisions for that event.
Edit on demand: Edit Mode toggles configuration without cluttering read mode.

.svg)
.png)